The Thirteen Chapters — one chart each
Start here. This book is the lens the rest of the catalog is built on. It teaches one distinction — value earned by work versus value collected by position — and shows it operating on two axes. Each chapter below carries its promise and its one signature chart.
Who owns the book of what happened
Whoever owns the ledger, the meter, and the grade captures the value that flows past it. Ten patterns, Chapters 2–11.
Who owns the model and the meter
The same extraction logic, one layer up: whoever owns the model, the ranking, and the attention meter captures the value that flows through the mind. Chapter 12.
The Way of Seeing
Learn to see every economic system through one lens — who owns the record, the relationship, the price, and trust — and to tell value earned by work apart from value collected by position.
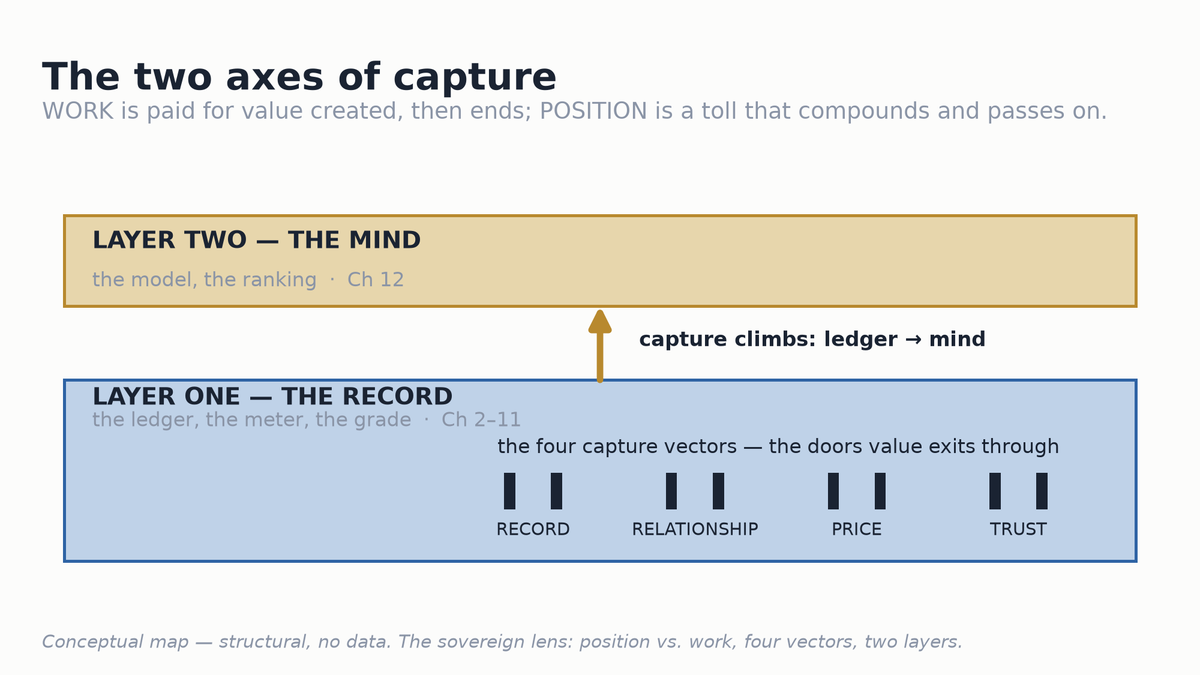
What the chart shows. Conceptual map, no data: work is paid for value created and then ends; position is a toll that compounds and passes on — four capture vectors, two layers.
The Counterparty's Scale
See how a large counterparty's scale is used to extract better terms from smaller parties — and how an independent, portable record tilts the table back.
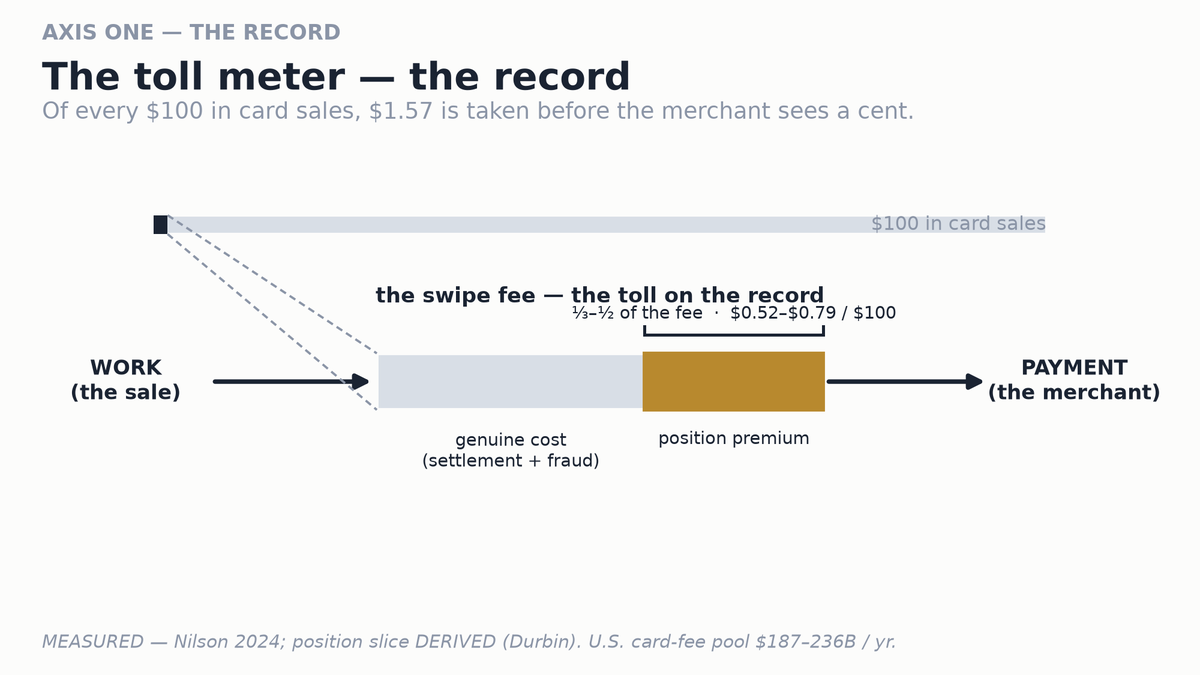
What the chart shows. Of every $100 in card sales, $1.57 is taken before the merchant sees a cent; roughly $0.52–0.79 of it is position, not cost. [MEASURED Nilson 2024 · slice DERIVED]
Renting Your Own Memory
Recognize when you pay to store and retrieve records of your own activity — and how keeping your own copy makes the exit cheap again.
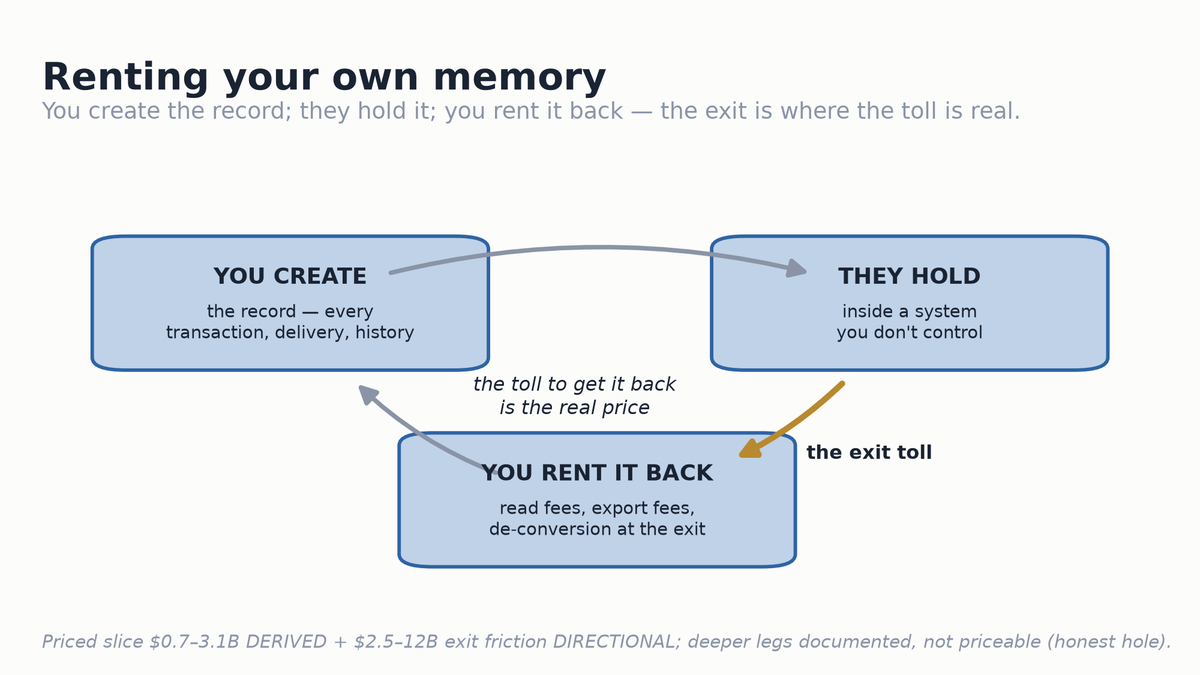
What the chart shows. You create the record, they hold it, you rent it back — the toll to get it back at the exit is the real price. [priced slice $0.7–3.1B DERIVED · deeper legs an honest hole]
The Prove-It-Again Treadmill
See how repeated proof requirements become ongoing extraction — and how one portable, reusable proof steps you off the treadmill.
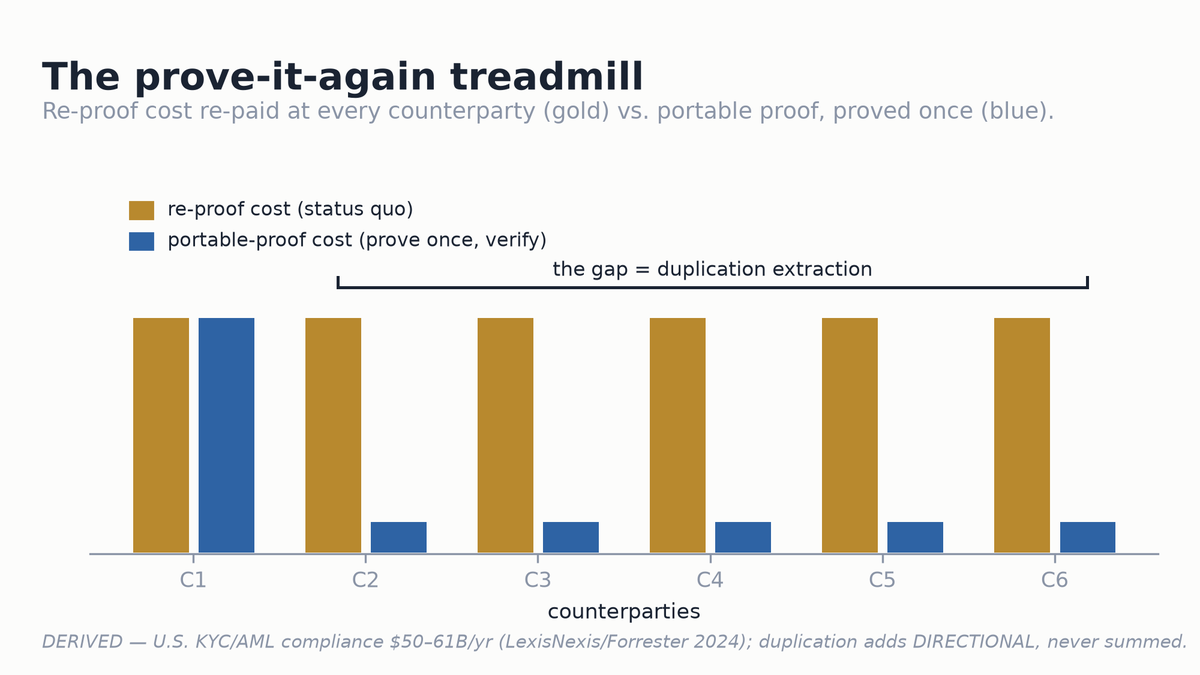
What the chart shows. Re-proof cost is re-paid at every counterparty; a portable proof is proved once and verified in seconds. [US KYC/AML $50–61B/yr DERIVED]
Sold Back Your Own Signal
Understand how your attention and behavior are captured, priced, and sold back to you — and what a direct, consented relationship restores.
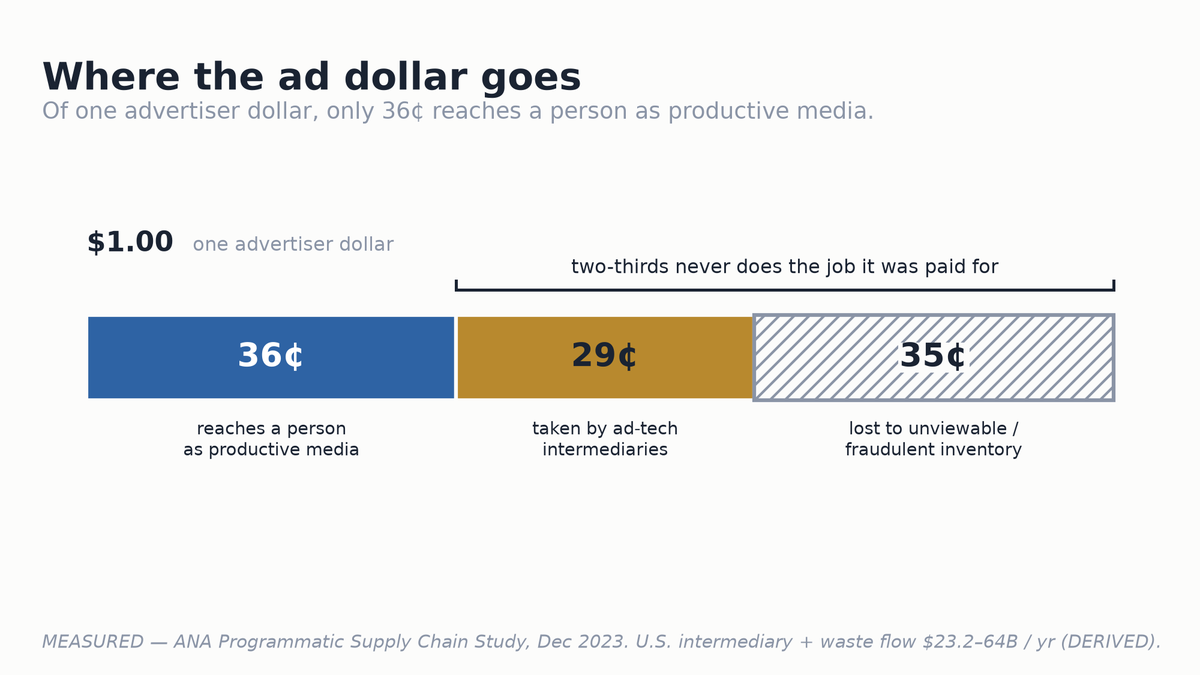
What the chart shows. Of one advertiser dollar, only 36¢ reaches a person as media — 29¢ to intermediaries, 35¢ lost to waste. [MEASURED ANA 2023]
The Dark Middle Spread
Measure the spread between what a producer receives and a consumer pays — and separate real intermediary work from positional rent with the specialist test.
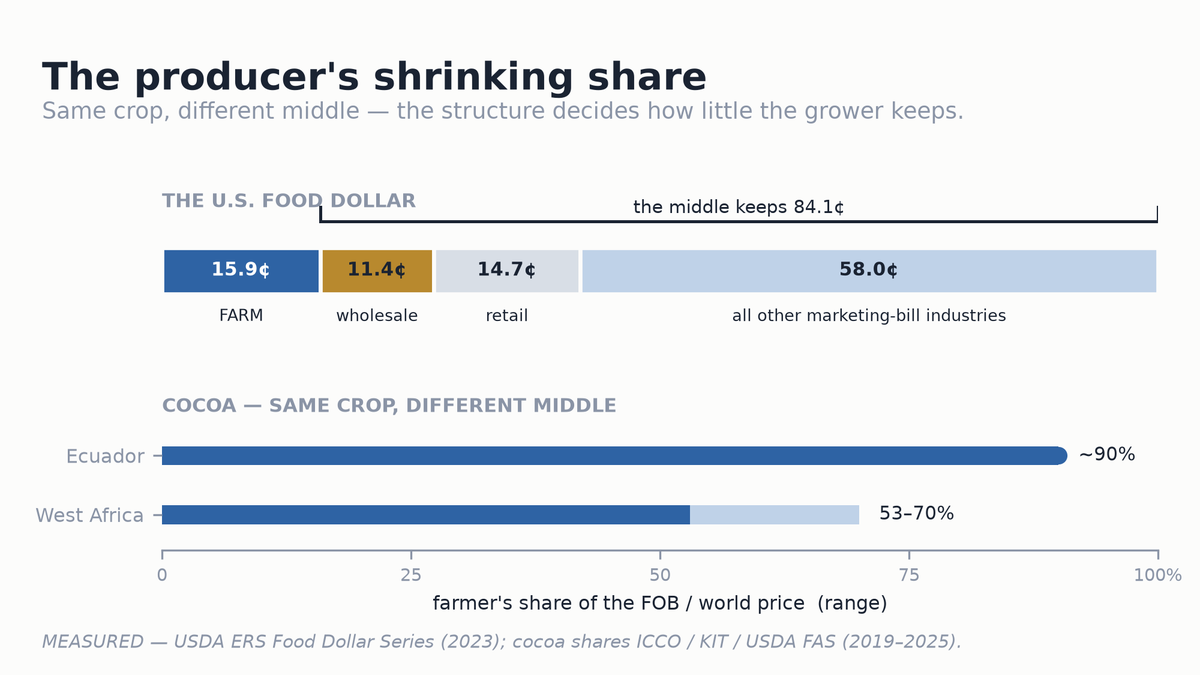
What the chart shows. Same crop, different middle: the US food dollar leaves the farm at 15.9¢, and cocoa growers keep ~53–70% versus ~90% on structure alone. [MEASURED USDA ERS · ICCO]
The Opacity Premium
Recognize when a price is high because it is hidden, not because the service is costly — and see how a small, opaque fee compounds into an enormous lifetime cost.
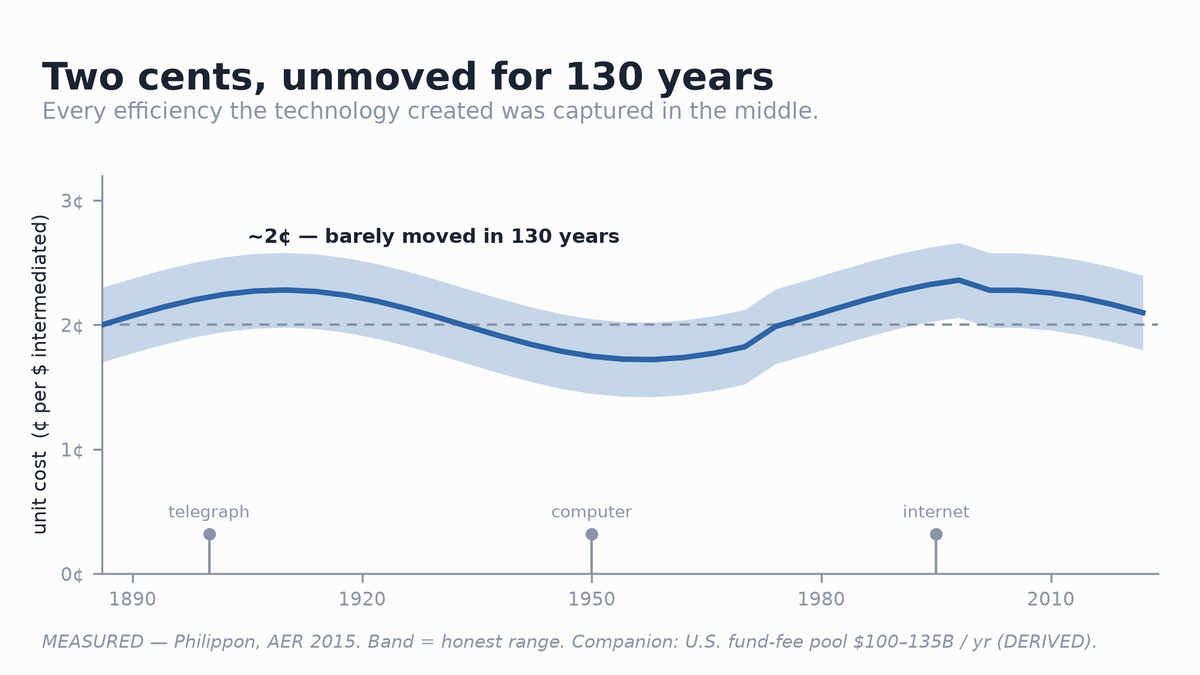
What the chart shows. The unit cost of US financial intermediation has held near 2¢ per dollar for ~130 years — every efficiency captured in the middle. [MEASURED Philippon, AER 2015]
The Green Proof Tax
See how the cost of proving a clean or ethical practice can exceed the reward for doing it — pricing out the small honest producer.
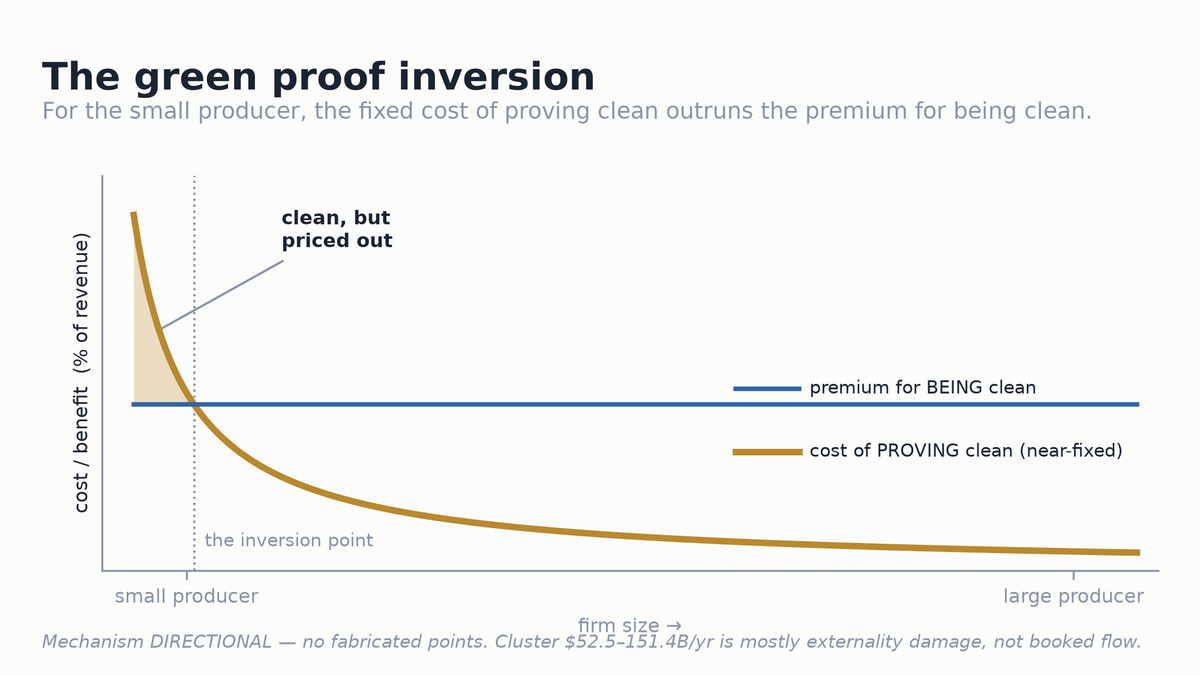
What the chart shows. For the small producer, the near-fixed cost of proving clean outruns the premium for being clean. [mechanism DIRECTIONAL · cluster mostly externality damage, not booked flow]
Livelihood on a Revocable Key
See the risk of building income on a platform that can revoke access without appeal — and how multiple rails and a portable record make a livelihood resilient.
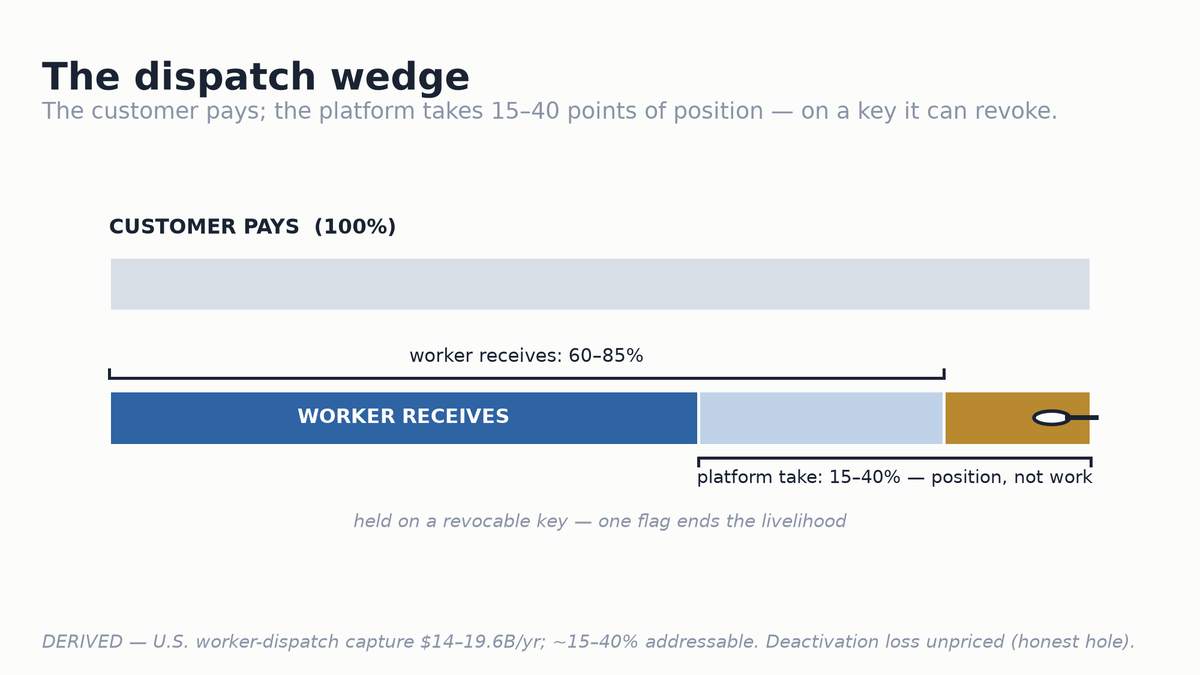
What the chart shows. The customer pays; the platform takes 15–40 points of position on a key it can revoke. [US worker-dispatch $14–19.6B/yr DERIVED · deactivation loss unpriced]
Death at the Handoff
See why the generational or ownership handoff is the single greatest moment of value loss — and how a receipted, portable record turns a lossy handoff into a clean inheritance.
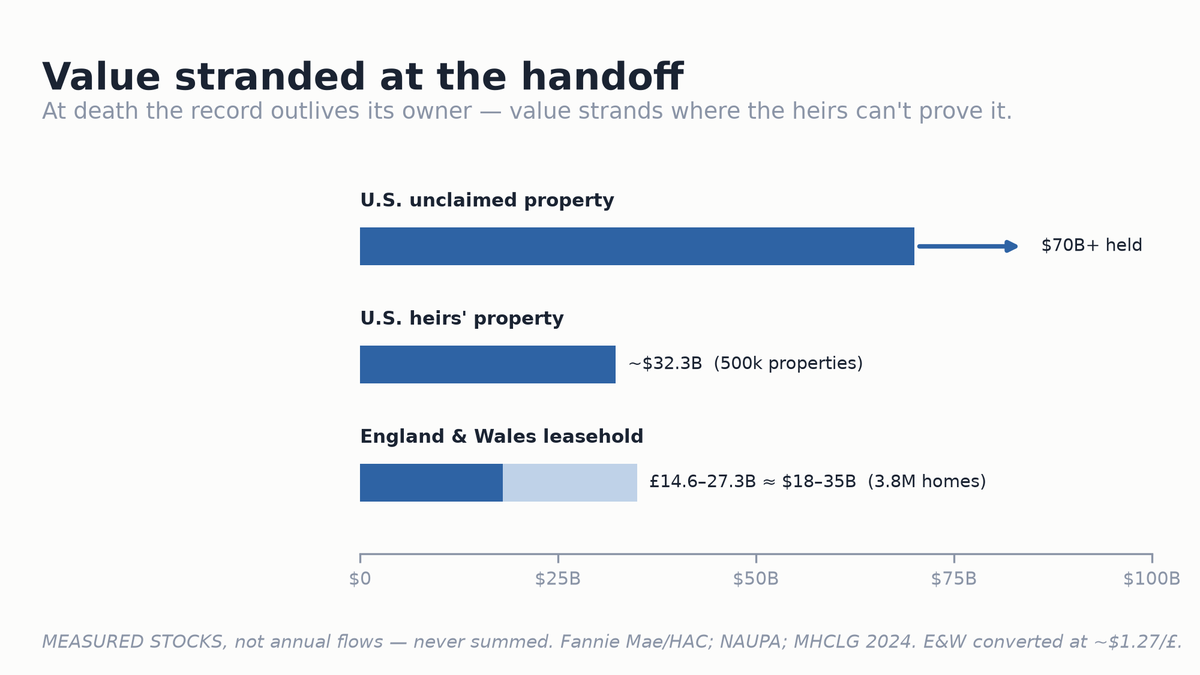
What the chart shows. At death the record outlives its owner: $70B+ unclaimed, ~$32B heirs' property, billions in leasehold — value strands where heirs can't prove it. [MEASURED stocks · never summed]
The Unpooled Many
See how fragmentation keeps many small parties from collective power — and how governed, receipted pooling restores leverage without surrendering independence.
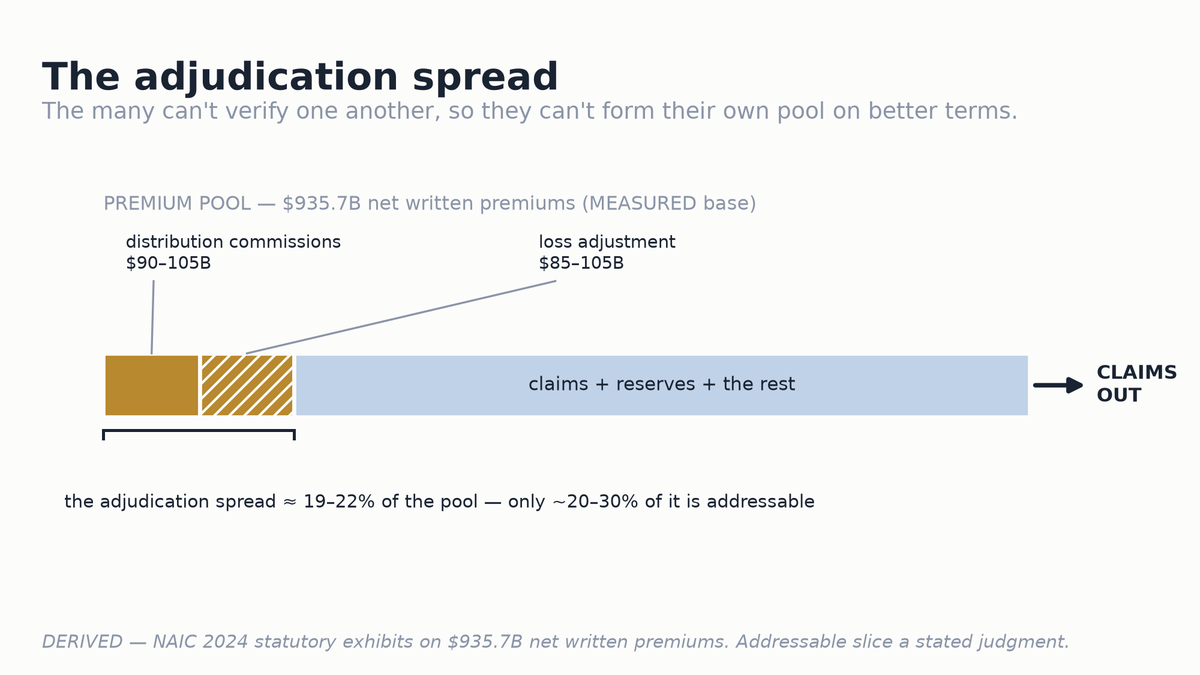
What the chart shows. The adjudication spread is ~19–22% of a $935.7B premium pool — the many can't verify one another to form a better pool. [DERIVED NAIC 2024]
The Metered Mind
See the second axis of capture — how concentrated AI meters attention, behavior, and intelligence by the same mechanism as the ledger — and the sovereign-AI alternative that serves without retaining.
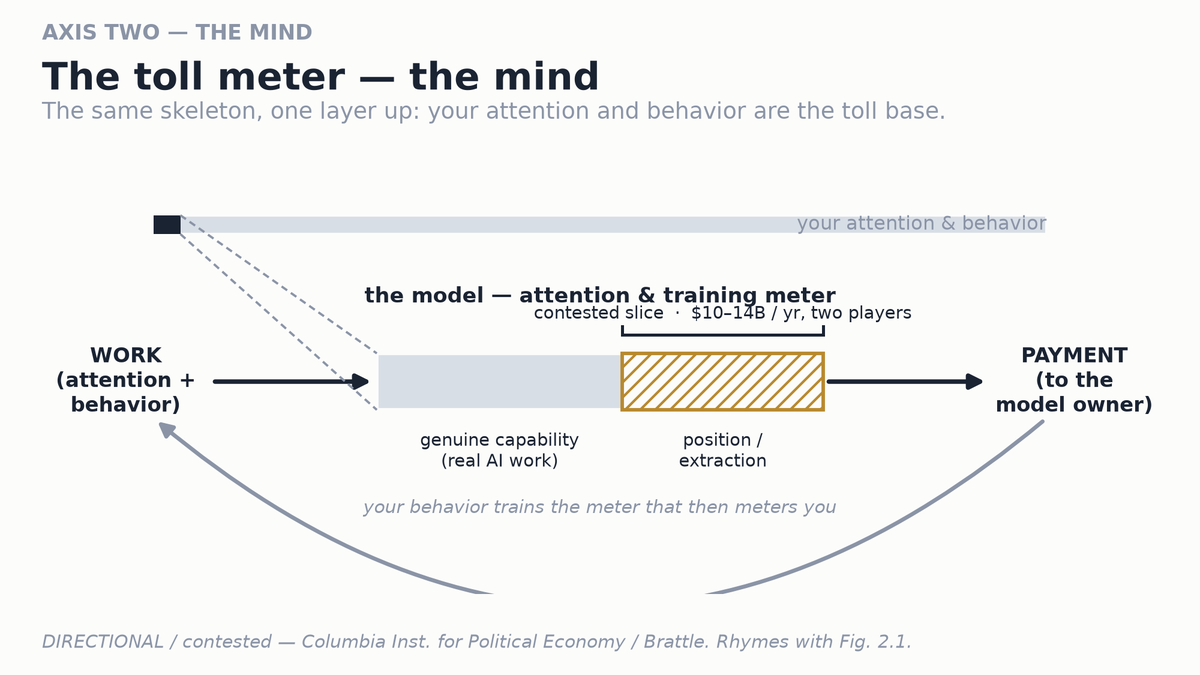
What the chart shows. The same skeleton one layer up: your attention and behavior are the toll base; the contested slice runs ~$10–14B/yr for two players. [DIRECTIONAL/contested · Columbia / Brattle]
The Counter-Principles
Leave with seven durable principles for keeping more of what you create — and the proof that positional rent has already been engineered to zero at national scale.
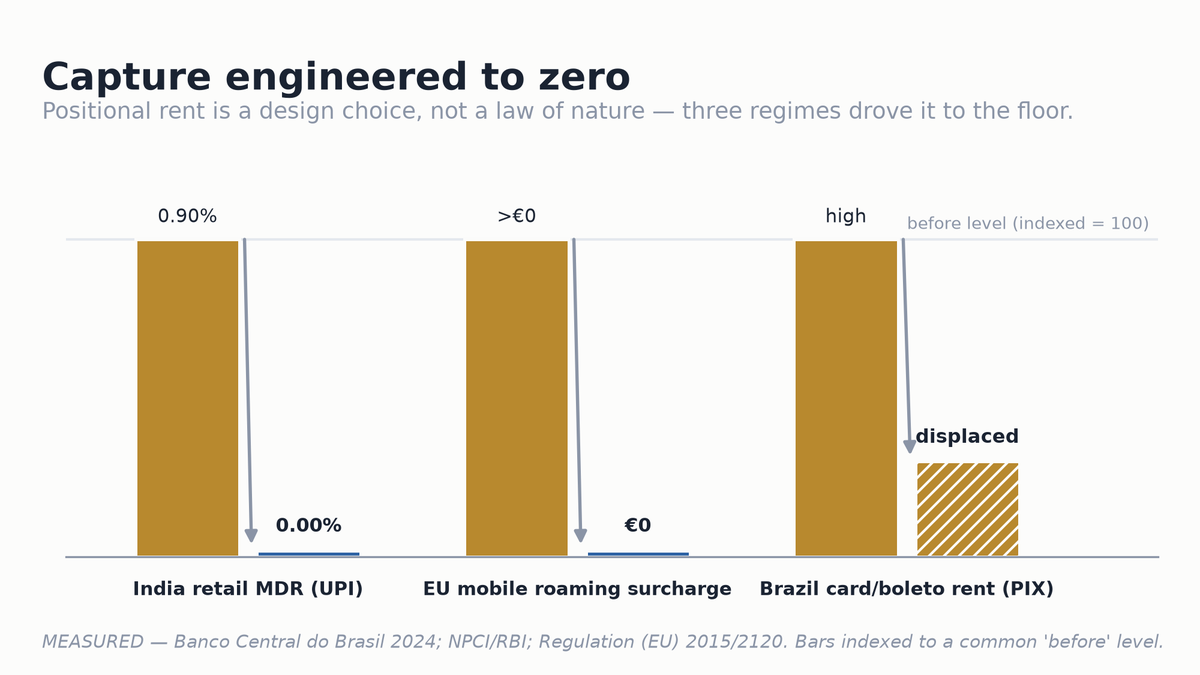
What the chart shows. Positional rent driven to the floor by design in three regimes — India's UPI to 0.00%, EU roaming to €0, Brazil's PIX displacing card rent. [MEASURED BCB · NPCI/RBI · EU]
S0 names it. Each series solves its slice.
The Capture Economy names the problem — who captures value, and how. The rest of the catalog is the answer, built one slice at a time. Every walkthrough on this site is one of these slices, run in front of you.
| Series 1 | Agentic AI Playbooks for Executives | Keep your ledger, at the scale of a governed agent fleet — every action an AI takes leaves a receipt an executive can audit and own. |
| Series 2 | Building the Agentic Harness | Answer the metered mind (Axis two) — intelligence that runs on infrastructure you control, serves without retaining you, and stays under a human hand. |
| Series 3 | Programmable Sovereign ERP | Keep your record — the obligation ledger and human approval gate that make the book of what happened yours, not a counterparty's. |
| Series 4 | Sovereign Token & Economic Organism | What recirculates, compounds — turn a kept record into private obligations and yield that build for the people who come after you. |