The pattern travels — a world tour
The lens is not an American story. Point it anywhere and the same shapes appear — under civil-law notaries, super-app duopolies, mandated market yards, cross-border corridors, and toll-road concessions. Different costumes, same position: whoever owns the record, the meter, or the grade collects from the work that flows past.
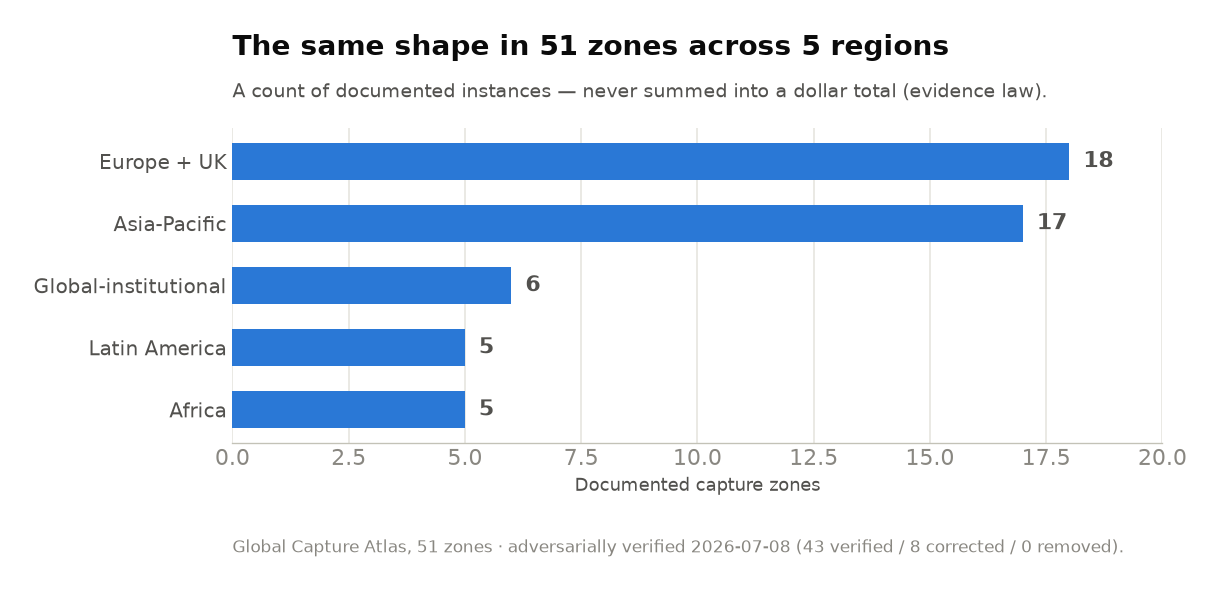
51 documented zones across 5 regions. This is a count of where the pattern shows up — never a summed dollar total (you cannot add a Brazilian real to a Kenyan shilling, and the atlas never does). measured
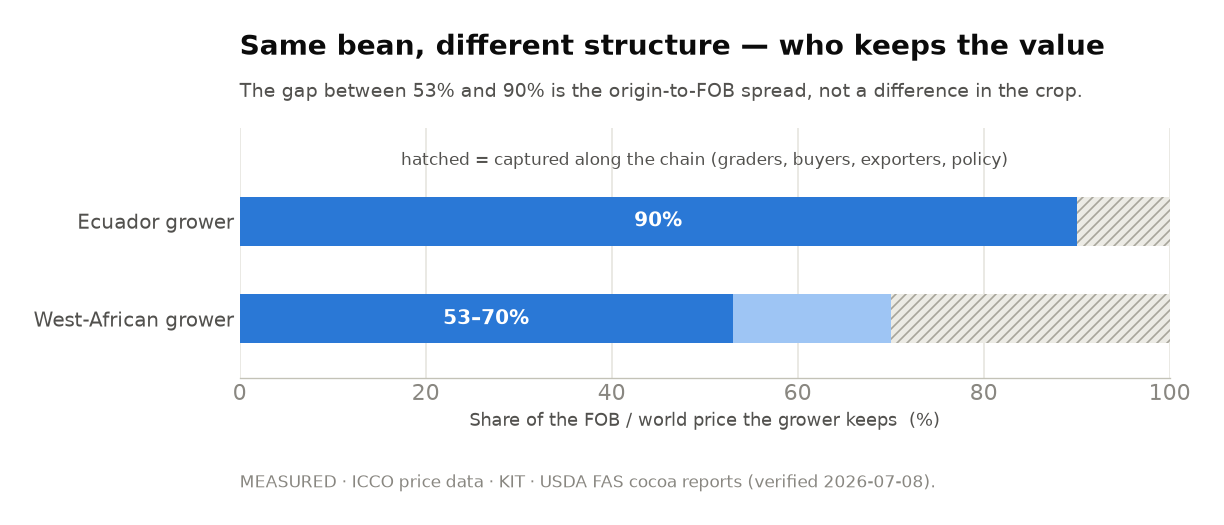
Who keeps the value in a chocolate bar's beans. A West-African cocoa grower keeps about 53–70% of the world price; an Ecuadorian grower keeps roughly 90%. Same crop — the gap is the chain standing between the farm and the price, not anything about the bean. measured
Each is one of the strongest measured or derived zones — where it happens, the everyday story, the number, and the source that published it.
The card fee that migrated
Europe capped the card interchange fee at 0.2–0.3%. So the card schemes grew the fee they didn't cap — the average merchant charge nearly doubled in four years. Cap one position, the toll refills through the part you missed.
measuredMobile money, both sides of the story
Mobile money reached hundreds of millions the banks had ignored — a real break from branch capture. Then, as the dominant rail (M-Pesa alone ~298,900 agents, ~35.8M monthly users), it set its own price on cashing out. Disruption, then consolidation.
measuredFarm support that lands on land
The EU pays farm support largely per hectare, so its value attaches to land — and about 80% of the direct payments flow to the largest 20% of recipients. Own the hectares, collect the subsidy, whether or not you farm.
measuredThe ceiling that became the floor
Japan caps the estate-agent fee by law at 3% + ¥60,000 per side. In practice the legal ceiling became the customary price — and it's charged to both buyer and seller, so a single deal pays it roughly twice.
measuredThe shelf between farm and table
Two chains hold about two-thirds of Australian grocery sales — Woolworths ~38%, Coles ~29%. The regulator found their margins among the highest of comparable countries, with no illegal gouging. The position is the shelf itself.
measuredWhen the regulator names the toll
China's market regulator fined its largest platforms for forcing merchants to 'choose one of two' — Alibaba's penalty was set explicitly at 4% of a year's revenue. A government pricing the gate is the clearest possible proof the gate was extracting. (A one-time fine, not an annual flow.)
measuredThe migrant's dollar at the crossing
Sending money to Mexico — one of the world's cheapest, largest corridors — still costs about 4–6% at the counter, above the ~3% the world set as the target. On ~$64bn a year, that is billions taken at the crossing.
derivedPIX, UPI, and friends
The tour's most important stop is the exit. Positional rent is not a law of nature — it has been engineered to zero at national scale, more than once: Brazil's free public PIX rail, India's zero-fee UPI, Europe's abolished roaming charges, Africa's pooled PAPSS settlement, the EU's banned payment-for-order-flow. Not utopias — policy choices, already made.
See capture engineered down →The lens is the same everywhere: whoever owns the meter collects from the work that flows past it — and what one design captured, another design can give back.
This tour is the training layer. The full research document is free — all 51 zones by region, each with its mechanism, grade, and named public source.
The PDF carries its own status note; the numbers on this page reflect the 2026-07-08 verification pass (43 verified / 8 corrected / 0 removed).